Chapter 1. Introduction to Business Analytics
1.1 The Role of Analytics in Modern Organizations
Organizations today operate in environments characterized by intense competition, rapid technological change, and abundant data. Almost every interaction—customer purchases, web browsing behavior, supply chain events, sensor readings, and internal workflows—generates data that can, in principle, inform better decisions.
Business analytics is the discipline that converts this raw data into insights and, ultimately, into actions that improve performance. It combines quantitative methods, domain knowledge, and technology to support and enhance decision-making at all levels of the organization.
Key drivers behind the growing importance of analytics include:
- Digitalization of processes : Core business processes (sales, operations, finance, HR) increasingly run on digital platforms that capture detailed data.
- Declining cost of storage and computation : Cheaper cloud computing and storage make it feasible to store and analyze large volumes of data.
- Competitive pressure : Firms that leverage analytics can differentiate through more accurate pricing, better targeting, more reliable operations, and faster innovation.
- Executive expectations : Senior leaders increasingly expect evidence-based justifications for strategic and tactical decisions.
Analytics is no longer a "nice-to-have" or a purely technical function; it is a core capability. Organizations that systematically use data and analytics often display:
- More consistent and transparent decision processes
- Faster response to changing market conditions
- Better allocation of resources and capital
- Improved customer experiences and engagement
This book focuses on how to build and apply such capabilities in a disciplined way—balancing technical methods with managerial judgment.
1.2 From Data to Decisions: The Analytics Value Chain
Data, by itself, rarely creates value. It must be transformed and embedded into processes that influence decisions. This transformation can be described as an analytics value chain —a sequence of stages through which raw data becomes business impact.
A typical analytics value chain includes:
1. Data Generation and Capture
Data originates from operational systems (e.g., ERP, CRM, POS), digital interactions, machines and sensors, and external sources (e.g., market data, open data).
Key design question
: Are we capturing the right data at the right level of detail?
2. Data Storage and Integration
Data is stored and integrated in databases, data warehouses, or data lakes. Tasks include consolidating data from multiple systems, aligning formats and identifiers, and ensuring basic data quality.
Key design question
: Can we reliably access consistent, well-structured datasets for analysis?
3. Data Preparation and Exploration
Analysts clean the data, handle missing values, detect anomalies, and perform exploratory data analysis. Initial descriptive statistics and visualizations help form hypotheses and identify patterns or issues.
Key design question
: Do we understand the structure, limitations, and key features of the data?
4. Modeling and Analysis
Depending on the problem, techniques range from descriptive statistics and dashboards to machine learning, forecasting, simulation, and optimization. Models are trained, validated, and interpreted in the context of business questions.
Key design question
: Does the chosen method adequately address the problem, given constraints and objectives?
5. Insight Generation and Communication
Model outputs must be converted into clear, decision-relevant insights. Data visualization and storytelling are used to explain findings, uncertainty, and trade-offs to stakeholders.
Key design question
: Are insights understandable, credible, and actionable for decision-makers?
6. Decision and Action
Insights influence decisions—either through traditional human decision-making or automated systems. Examples include adjusting prices, changing inventory levels, redesigning marketing campaigns, or prioritizing leads.
Key design question
: How are analytics outputs embedded into actual workflows and tools?
7. Measurement and Learning
The impact of decisions informed by analytics is measured (e.g., uplift in sales, reduction in costs, improved service levels). Feedback is used to refine models, data pipelines, and decision rules.
Key design question
: Are we closing the loop and learning from outcomes?
Understanding this value chain is essential for avoiding a common trap: investing heavily in data infrastructure or sophisticated models without ensuring that insights actually reach decision-makers or influence actions. The most successful analytics initiatives are those that design the entire chain with the end decision in mind.
1.3 Types of Business Decisions: Strategic, Tactical, Operational
Business decisions vary widely in scope, frequency, and impact. Analytics can support all types of decisions, but the methods, data requirements, and stakeholders differ significantly across decision levels.
Strategic Decisions
Strategic decisions shape the long-term direction of the organization. They are typically made by senior executives and boards, occur infrequently, and have high stakes.
Examples :
- Should we enter a new market or product category?
- Which business units should we invest in or divest?
- How should we position ourselves relative to competitors?
- What digital transformation initiatives should we prioritize?
Analytics role
:
Analytics supports strategic decisions through market analysis, competitive benchmarking, scenario planning, and financial modeling. The emphasis is on understanding trends, uncertainties, and trade-offs rather than precision. Qualitative judgment remains central, but analytics provides a structured evidence base.
Tactical Decisions
Tactical decisions translate strategy into concrete plans and resource allocations. They are made by middle management, occur periodically (e.g., quarterly or monthly), and involve moderate stakes.
Examples :
- How should we allocate the marketing budget across channels?
- What inventory levels should we target for the next quarter?
- Which customer segments should the sales team prioritize?
- How many staff should we schedule for peak periods?
Analytics role
:
Analytics plays a more direct role here, often through forecasting, optimization, and segmentation. Decisions are more structured and repeatable, making it feasible to build models that can be reused and refined over time.
Operational Decisions
Operational decisions are day-to-day choices that keep the business running. They are made by frontline managers and employees, occur frequently (even continuously), and individually have low stakes—but collectively drive performance.
Examples :
- Which customer inquiries should be prioritized today?
- Should we approve this credit application?
- What price should we offer this customer right now?
- Which route should the delivery driver take?
Analytics role
:
Operational decisions are increasingly supported by automated or semi-automated analytics systems. Predictive models, business rules, and optimization algorithms can be embedded directly into operational systems (e.g., CRM, pricing engines, logistics platforms). The challenge is ensuring these systems are reliable, transparent, and aligned with broader business objectives.
The Analytics Pyramid
A useful mental model is the "analytics pyramid":
- At the base (operational level): high volume, high frequency, narrow scope, often automated.
- In the middle (tactical level): moderate volume and frequency, broader scope, human-in-the-loop.
- At the top (strategic level): low volume, low frequency, very broad scope, heavily reliant on judgment.
Effective analytics organizations build capabilities across all three levels and ensure alignment between them.
1.4 Business Analytics vs. Business Intelligence vs. Data Science
The terms business analytics , business intelligence , and data science are often used interchangeably, but they have distinct emphases and historical origins. Understanding these distinctions helps clarify roles, expectations, and skill requirements.
Business Intelligence (BI)
Business intelligence refers to the technologies, processes, and practices for collecting, integrating, and presenting business data to support decision-making. BI is primarily
descriptive
and
backward-looking
.
Core activities :
- Building dashboards and reports
- Monitoring KPIs and performance metrics
- Providing drill-down and slice-and-dice capabilities
- Ensuring data consistency and accessibility
Typical tools : Tableau, Power BI, Looker, QlikView, SQL-based reporting
Focus : "What happened?" and "What is happening now?"
BI is essential for operational transparency and accountability. However, traditional BI does not typically involve predictive modeling or prescriptive recommendations.
Business Analytics (BA)
Business analytics extends BI by incorporating
diagnostic
,
predictive
, and
prescriptive
methods. It emphasizes not just reporting what happened, but understanding
why
it happened and
what is likely to happen
in the future—and, ideally,
what should be done
about it.
Core activities :
- Root cause analysis and attribution
- Forecasting and predictive modeling
- Segmentation and pattern discovery
- Optimization and simulation
- A/B testing and experimentation
Typical tools : Python, R, Excel (advanced), specialized analytics platforms, SQL + statistical/ML libraries
Focus : "Why did it happen?", "What will happen?", and "What should we do?"
Business analytics is the primary focus of this book. It assumes a business context and emphasizes practical application, interpretability, and alignment with organizational goals.
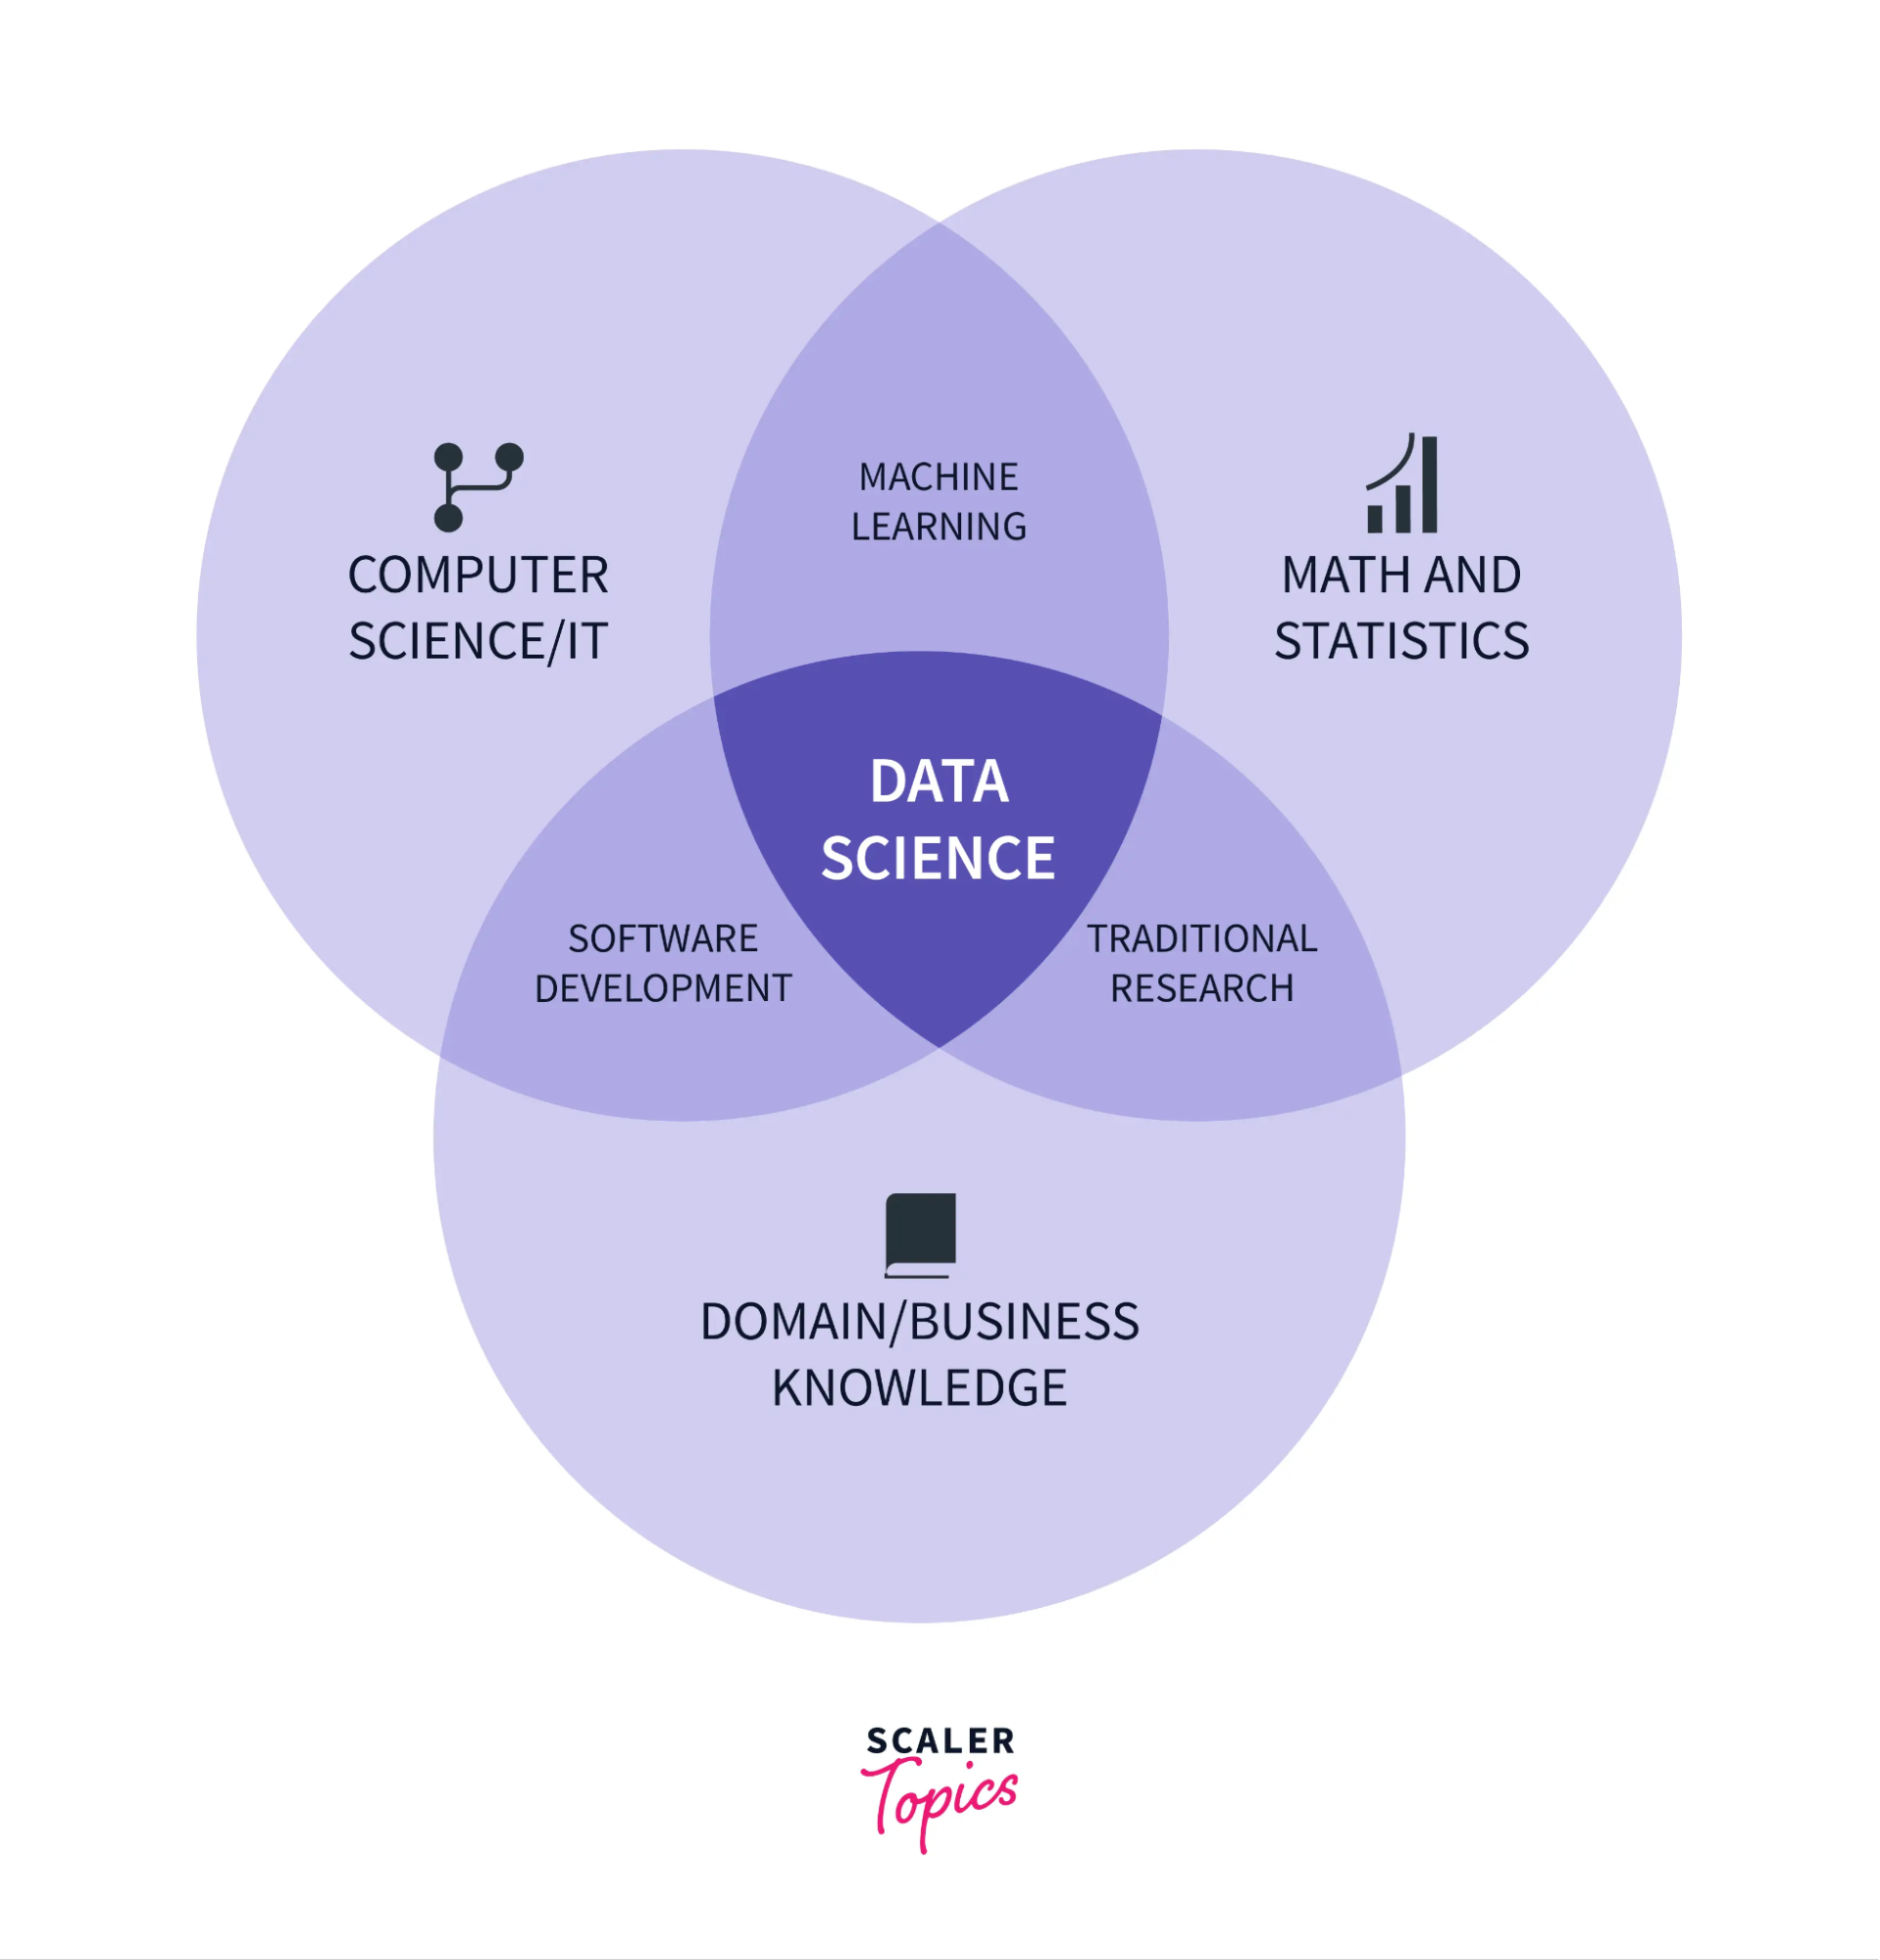
Data Science
Data science is a broader, more technical discipline that encompasses statistics, machine learning, programming, and domain expertise. Data science often involves exploratory research, algorithm development, and working with unstructured or novel data sources.
Core activities :
- Developing and tuning machine learning models
- Working with large-scale, unstructured, or streaming data
- Building data pipelines and infrastructure
- Conducting experiments and research
- Deploying models into production systems
Typical tools : Python, R, Spark, TensorFlow, cloud platforms (AWS, GCP, Azure), version control (Git)
Focus : "How can we extract value from data using advanced computational and statistical methods?"
Data science overlaps significantly with business analytics, but tends to be more technical, less constrained by immediate business problems, and more focused on innovation and scalability.
Positioning This Book
This book sits squarely in the
business analytics
space. We assume:
- A business problem or decision context is the starting point.
- Methods should be interpretable and actionable.
- Readers have basic quantitative skills but are not necessarily programmers or statisticians.
- Practical application in realistic organizational settings is the priority.
We will use tools and methods from data science (especially Python and machine learning), but always with a business analytics lens.
1.5 Core Skills and Mindset for Business Analysts
Effective business analysts combine technical competence, business acumen, and communication skills. No single person needs to be an expert in everything, but successful analytics professionals typically develop capabilities across several domains.
1. Quantitative and Statistical Thinking
Analysts must be comfortable with numbers, distributions, relationships, and uncertainty. This includes:
- Descriptive statistics and data summarization
- Probability and statistical inference
- Understanding correlation vs. causation
- Recognizing when a pattern is meaningful vs. noise
Mindset : Healthy skepticism. Always ask: "Is this pattern real? Could it be due to chance, bias, or data quality issues?"
2. Technical Skills
Modern analytics requires working with data programmatically. Key technical skills include:
- Data manipulation (filtering, aggregating, joining datasets)
- Data visualization
- Basic programming (Python is emphasized in this book)
- Familiarity with databases and SQL
- Understanding of machine learning concepts and workflows
Mindset : Continuous learning. Technology evolves rapidly; staying current is essential.
3. Business and Domain Knowledge
Analytics is only valuable if it addresses real business problems. Analysts need to understand:
- How the business operates and makes money
- Key performance drivers and constraints
- Industry context and competitive dynamics
- Organizational structure, culture, and decision processes
Mindset : Curiosity about the business. Ask: "Why does this matter? Who cares about this metric? What would change if we knew the answer?"
4. Problem Framing and Critical Thinking
Before jumping into data and models, analysts must frame the problem clearly:
- What decision needs to be made?
- What are the alternatives?
- What information would reduce uncertainty or improve the decision?
- What are the constraints (time, data, resources)?
Mindset : Start with the decision, not the data. Avoid "analysis for analysis's sake."
5. Communication and Storytelling
Technical rigor is wasted if insights are not understood or trusted. Analysts must:
- Tailor messages to different audiences (executives, managers, technical peers)
- Use visualizations effectively
- Explain uncertainty and limitations honestly
- Build narratives that connect data to decisions
Mindset : Empathy for the audience. Ask: "What does this person need to know? What will convince them? What might they misunderstand?"
6. Collaboration and Influence
Analytics is rarely a solo activity. Analysts work with IT, business units, executives, and external partners. Success requires:
- Building trust and credibility
- Navigating organizational politics
- Managing stakeholder expectations
- Advocating for data-driven approaches without being dogmatic
Mindset : Partnership, not gatekeeping. Analytics should enable others, not create bottlenecks.
The T-Shaped Analyst
A useful metaphor is the "T-shaped" professional:
- The vertical bar represents deep expertise in one or two areas (e.g., machine learning, supply chain analytics).
- The horizontal bar represents broad familiarity across multiple domains (business, technology, communication).
Organizations benefit from teams with diverse T-shapes, where individuals' strengths complement each other.
1.6 Analytics Projects: Lifecycle and Typical Pitfalls
Analytics projects—whether building a dashboard, developing a predictive model, or conducting a one-time analysis—follow a recognizable lifecycle. Understanding this lifecycle helps set realistic expectations and avoid common mistakes.
Typical Analytics Project Lifecycle
1. Problem Definition and Scoping
- Clarify the business problem and decision context.
- Define success criteria and constraints (time, budget, data availability).
- Identify stakeholders and decision-makers.
Common pitfall : Starting with data or methods before understanding the problem. This leads to technically impressive but irrelevant work.
2. Data Discovery and Assessment
- Identify potential data sources.
- Assess data availability, quality, and coverage.
- Understand data definitions, lineage, and limitations.
Common pitfall : Assuming data is "ready to use." In reality, 50–80% of project time is often spent on data issues.
3. Data Preparation
- Extract, clean, and integrate data.
- Handle missing values, outliers, and inconsistencies.
- Create derived features and variables.
Common pitfall : Underestimating the complexity and time required. Poor data preparation undermines all downstream work.
4. Exploratory Analysis
- Generate descriptive statistics and visualizations.
- Identify patterns, anomalies, and relationships.
- Formulate hypotheses and refine the approach.
Common pitfall : Skipping this step and jumping straight to modeling. Exploration builds intuition and often reveals issues or opportunities.
5. Modeling and Analysis
- Select and apply appropriate analytical methods.
- Train, validate, and tune models.
- Interpret results in business terms.
Common pitfall : Over-focusing on technical sophistication at the expense of interpretability and business relevance.
6. Validation and Testing
- Test models on holdout data or through experiments.
- Check robustness and sensitivity to assumptions.
- Validate findings with domain experts.
Common pitfall : Overfitting to the data at hand. Models that perform well in development often degrade in real-world use.
7. Communication and Deployment
- Present findings to stakeholders.
- Embed insights into decision processes or systems.
- Document methods, assumptions, and limitations.
Common pitfall : Treating the analysis as "done" once the model is built. Without effective communication and integration, insights have no impact.
8. Monitoring and Iteration
- Track model performance and business outcomes.
- Update models as data or business conditions change.
- Capture lessons learned for future projects.
Common pitfall : "Set it and forget it." Models and insights degrade over time and need ongoing attention.
Key Success Factors Across the Lifecycle
- Stakeholder engagement : Involve decision-makers early and often. Ensure alignment on objectives and expectations.
- Iterative approach : Don't try to build the perfect solution in one pass. Start simple, learn, and refine.
- Documentation : Record decisions, assumptions, and methods. This supports reproducibility and knowledge transfer.
- Realistic timelines : Analytics projects almost always take longer than initially expected. Build in buffer time.
- Focus on impact, not perfection : A simple, timely analysis that influences a decision is more valuable than a sophisticated model that arrives too late or is too complex to use.
Common Reasons Analytics Projects Fail
- Poorly defined problem or success criteria
- Lack of executive sponsorship or stakeholder buy-in
- Inadequate or inaccessible data
- Overly ambitious scope or unrealistic timelines
- Disconnect between analysts and decision-makers
- Failure to integrate insights into workflows
- Lack of follow-through and measurement
Understanding these pitfalls helps analytics professionals navigate projects more effectively and set realistic expectations with stakeholders.
Exercises
Exercise 1.1: Concept Check
Define the following terms in your own words and explain how they differ:
- Business Intelligence
- Business Analytics
- Data Science
Provide one example of a task or project that would fall primarily into each category.
Exercise 1.2: Analytics Value Chain Mapping
Choose a business function you are familiar with (e.g., marketing, supply chain, customer service, finance). Map out the analytics value chain for a specific decision or process within that function:
- What data is generated and captured?
- Where and how is it stored?
- What preparation or cleaning is typically needed?
- What analysis or modeling is (or could be) performed?
- How are insights communicated?
- How do insights influence decisions or actions?
- How is impact measured?
Identify at least one weakness or gap in the current value chain and propose an improvement.
Exercise 1.3: Decision Classification
For each of the following decisions, classify it as
strategic
,
tactical
, or
operational
. Briefly explain your reasoning and describe what role analytics could play.
a) A retail chain deciding whether to open stores in a new country.
b) A bank determining the interest rate to offer an individual mortgage applicant.
c) A manufacturer allocating production capacity across product lines for the next quarter.
d) An e-commerce company deciding which products to feature on the homepage today.
e) A hospital system evaluating whether to invest in a new specialty clinic.
Exercise 1.4: Skills Self-Assessment
Review the six core skill areas for business analysts described in Section 1.5:
- Quantitative and statistical thinking
- Technical skills
- Business and domain knowledge
- Problem framing and critical thinking
- Communication and storytelling
- Collaboration and influence
For each area, rate your current proficiency on a scale of 1 (beginner) to 5 (expert). Identify:
- Your strongest area
- The area where you have the most room to grow
- One concrete action you can take in the next month to develop a skill in your weakest area
Exercise 1.5: Project Pitfall Analysis
Read the following scenario:
A retail company launched an analytics project to predict customer churn. The data science team spent three months building a sophisticated machine learning model with 92% accuracy. When they presented the results to the marketing team, the marketers were confused by the technical details and unsure how to use the model. The model was never deployed, and the project was considered a failure.
a) Identify at least three pitfalls from Section 1.6 that likely contributed to this failure.
b) For each pitfall, suggest one specific action the team could have taken to avoid or mitigate it.
c) If you were leading this project, what would you do differently from the start?
Exercise 1.6: From Data to Decision (Case Discussion)
Consider the following business scenario:
An online subscription service has noticed that its monthly revenue growth has slowed. The executive team wants to understand why and what actions to take.
Working individually or in a small group:
a) Frame this as an analytics problem. What specific questions should be answered?
b) What types of data would you need to access?
c) Sketch out an analytics approach. What methods or analyses would you use? (You don't need technical details—just describe the general approach.)
d) How would you communicate findings to the executive team?
e) What decisions or actions might result from the analysis?
Prepare a one-page summary or a 5-minute presentation of your approach.