Chapter 3. Data Foundations for Business Analytics
3.1 Data as a Strategic Asset
For decades, organizations have recognized traditional assets—physical capital, financial resources, intellectual property, brand equity—as sources of competitive advantage. In the 21st century, data has emerged as a strategic asset of comparable, and in some cases superior, importance.
But what does it mean to treat data as a strategic asset?
Strategic assets share several characteristics:
-
They are valuable
: They enable the organization to create value, serve customers better, operate more efficiently, or differentiate from competitors.
-
They are scarce or difficult to replicate
: Not every organization has access to the same data, and even when data is available, the ability to collect, organize, and leverage it effectively is rare.
-
They are durable
: They provide value over extended periods, though they may require maintenance and renewal.
-
They enable other capabilities
: They are foundational—other strategic initiatives depend on them.
Data meets all these criteria, but with important nuances.
Why Data Is Valuable
Data enables organizations to:
- Understand customers more deeply : Purchase history, preferences, behavior patterns, and feedback allow personalized experiences and targeted offerings.
- Optimize operations : Real-time data from supply chains, production lines, and logistics systems enable efficiency improvements and cost reductions.
- Reduce risk : Historical data on credit defaults, fraud patterns, equipment failures, and market volatility inform better risk management.
- Innovate faster : Data from experiments, prototypes, and market tests accelerates learning and product development.
- Make better decisions : Evidence-based decision-making reduces reliance on intuition and guesswork.
Consider examples:
- Amazon leverages vast customer behavioral data to power recommendation engines, dynamic pricing, and inventory optimization—creating a flywheel where more data leads to better customer experiences, which generates more data.
- Netflix uses viewing data to inform content acquisition, production decisions, and personalized recommendations, fundamentally changing how entertainment is created and consumed.
- Manufacturers use IoT sensor data from equipment to predict failures before they occur, reducing downtime and maintenance costs.
Data as a Differentiator
In many industries, access to unique, high-quality data is a key competitive advantage. Organizations that collect proprietary data—especially data that competitors cannot easily replicate—can build sustainable moats.
For example:
- Insurance companies with decades of claims data can price risk more accurately than new entrants.
- Retailers with detailed point-of-sale and loyalty program data understand local demand patterns better than competitors.
- Platforms (Google, Facebook, LinkedIn) accumulate user data at scale that creates network effects and barriers to entry.
However, data's strategic value is not automatic. Raw data sitting in databases creates no value. Data becomes a strategic asset only when:
- It is accessible to those who need it
- It is of sufficient quality to support decisions
- The organization has the capabilities to analyze and act on it
- It is governed responsibly to manage risk and maintain trust
The Data Asset Lifecycle
Like physical assets, data has a lifecycle:
- Acquisition/Creation : Data is generated through operations, collected from customers, purchased, or obtained from public sources.
- Storage and Management : Data is organized, secured, and made accessible.
- Enhancement : Data is cleaned, integrated, enriched with additional context.
- Utilization : Data is analyzed and used to inform decisions or power products.
- Maintenance : Data is updated, quality is monitored, and obsolete data is archived or deleted.
- Retirement : Data that is no longer useful or legally permissible to retain is securely disposed of.
Effective data asset management requires attention to each stage. Organizations that treat data as a strategic asset invest in infrastructure, governance, and capabilities across the entire lifecycle.
Data as a Responsibility
Treating data as an asset also means recognizing the responsibilities that come with it:
- Privacy : Customer and employee data must be protected and used ethically.
- Security : Data breaches can cause financial, reputational, and legal damage.
- Compliance : Regulations (GDPR, CCPA, industry-specific rules) impose obligations on data collection, use, and retention.
- Fairness : Data and algorithms built on it can perpetuate or amplify biases, leading to unfair outcomes.
Organizations that fail to manage these responsibilities risk losing customer trust, facing regulatory penalties, and damaging their brand.
Key Takeaway
Data is not automatically valuable. It becomes a strategic asset when organizations invest in collecting the right data, ensuring its quality, making it accessible, building analytical capabilities, and governing it responsibly. The remainder of this chapter explores the foundational concepts needed to manage data as a strategic asset effectively.
3.2 Data Types and Structures
Not all data is created equal. Understanding the different types and structures of data is essential for selecting appropriate storage solutions, analytical methods, and governance approaches.
3.2.1 Structured, Semi-Structured, and Unstructured Data
Data exists on a spectrum from highly organized to completely unorganized. This spectrum has major implications for how data is stored, processed, and analyzed.
Structured Data
Structured data is organized into a predefined format, typically rows and columns, with clear data types for each field. It fits neatly into relational databases and spreadsheets.
Characteristics :
- Fixed schema (defined columns and data types)
- Easy to search, query, and analyze using SQL
- Efficient storage and retrieval
- Examples: transactional records, customer databases, financial ledgers, sensor readings with fixed formats
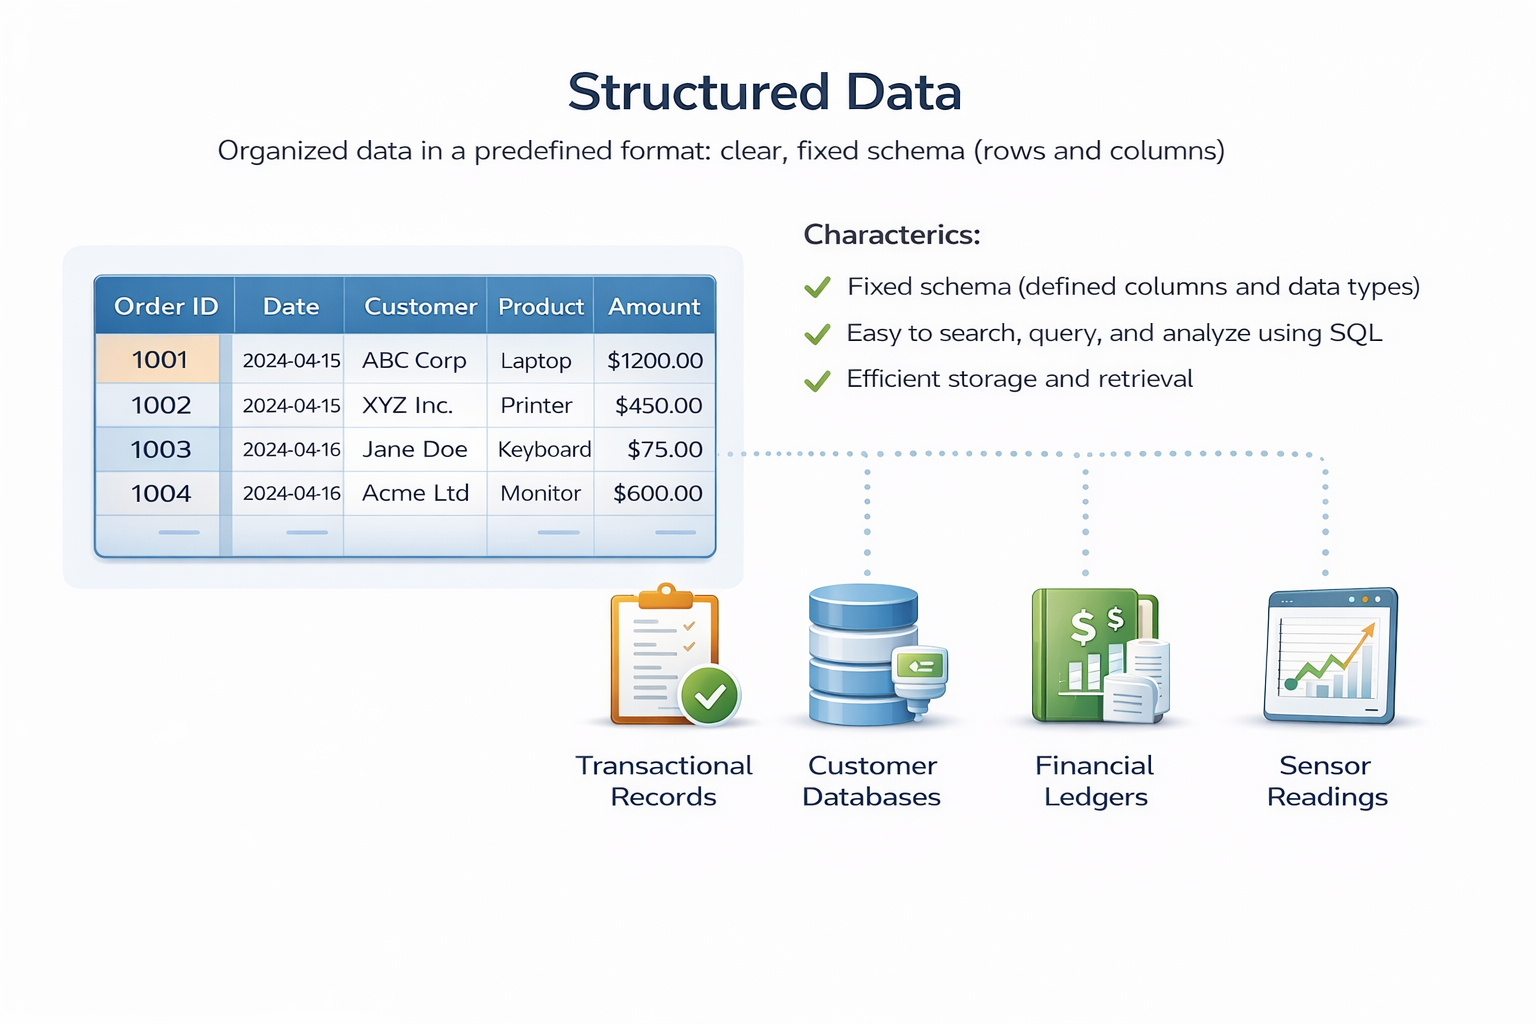
Figure 3.1 : Structured data. Each column has a defined data type (integer, text, date), and every row follows the same structure.
Semi-Structured Data
Semi-structured data has some organizational properties but does not conform to a rigid schema. It often includes metadata or tags that provide structure, but the structure can vary between records.
Characteristics :
- Flexible schema (fields can vary between records)
- Self-describing (includes metadata or tags)
- Common formats: JSON, XML, log files, email
- Requires parsing and transformation for analysis
Example : A JSON record from a web API:
{
"customerID": 1001,
"name": "Jane Smith",
"email": "jane@email.com",
"signupDate": "2023-01-15",
"preferences": {
"newsletter": true,
"notifications": false
},
"purchaseHistory": [
{"date": "2023-02-01", "amount": 49.99},
{"date": "2023-03-15", "amount": 89.99}
]
}
This record has nested structures (preferences, purchase history) that don't fit neatly into a single table row.
Unstructured Data
Unstructured data has no predefined format or organization. It is the most common type of data but also the most challenging to analyze.
Characteristics :
- No fixed schema
- Requires specialized processing (natural language processing, image recognition, etc.)
- Examples: text documents, emails, social media posts, images, videos, audio recordings, PDFs
Example : Customer service email: "Hi, I ordered product #12345 last week and it still hasn't arrived. Can you help?"
This text contains valuable information (product number, complaint type, sentiment) but requires processing to extract structured insights.
The Analytics Challenge
Historically, business analytics focused almost exclusively on structured data because it was easiest to work with. Today, the majority of organizational data is semi-structured or unstructured, and extracting value from it is a key competitive advantage.
Modern analytics platforms and techniques (NoSQL databases, text analytics, computer vision, natural language processing) increasingly enable organizations to leverage semi-structured and unstructured data alongside traditional structured data.
3.2.2 Transactional vs. Master vs. Reference Data
Within structured data, it is useful to distinguish between different functional types based on how the data is used and managed.
Transactional Data
Transactional data records business events or activities. Each record typically represents a single transaction or event at a specific point in time.
Characteristics :
- High volume, frequently updated
- Time-stamped
- Granular (individual events)
- Examples: sales transactions, website clicks, sensor readings, payment records, shipments
Example : Sales transaction table:
|
TransactionID |
CustomerID |
ProductID |
Quantity |
Price |
Timestamp |
|
T5001 |
1001 |
P200 |
2 |
49.99 |
2023-03-15 14:23:11 |
|
T5002 |
1002 |
P150 |
1 |
89.99 |
2023-03-15 14:25:43 |
Transactional data is the raw material for most analytics. It is aggregated, summarized, and analyzed to understand patterns, trends, and behaviors.
Master Data
Master data represents the core business entities that transactions refer to: customers, products, employees, suppliers, locations, assets.
Characteristics :
- Lower volume, less frequently updated
- Describes entities, not events
- Shared across systems and processes
- Requires careful governance to maintain consistency
- Examples: customer profiles, product catalogs, employee records, supplier lists
Example : Product master table:
|
ProductID |
ProductName |
Category |
UnitCost |
Supplier |
|
P200 |
Wireless Mouse |
Electronics |
15.00 |
TechCorp |
|
P150 |
Office Chair |
Furniture |
120.00 |
FurnCo |
Master data provides context for transactional data. When analyzing sales transactions, you join transactional data with product master data to understand which categories or suppliers are performing well.
Reference Data
Reference data consists of classification schemes, codes, and lookup tables used to categorize and standardize other data.
Characteristics :
- Small, stable datasets
- Used for validation and standardization
- Examples: country codes, currency codes, product categories, status codes, industry classifications
Example : Country reference table:
|
CountryCode |
CountryName |
Region |
Currency |
|
USA |
United States |
North America |
USD |
|
ESP |
Spain |
Europe |
EUR |
Reference data ensures consistency. Instead of storing "United States," "USA," "US," and "U.S.A." inconsistently across systems, you store a standard country code and reference the lookup table.
Why These Distinctions Matter
- Data quality : Master and reference data require stricter governance because errors propagate across all transactions that reference them.
- Analytics design : Different data types require different storage and processing strategies (e.g., transactional data in data warehouses, master data in MDM systems).
- Integration : Linking transactional, master, and reference data correctly is essential for meaningful analysis.
3.2.3 Time Series, Panel, and Cross-Sectional Data
Another important classification relates to the temporal and cross-sectional structure of data—particularly relevant for statistical analysis and forecasting.
Cross-Sectional Data
Cross-sectional data captures observations across multiple entities at a single point in time (or without regard to time).
Example : Survey of 1,000 customers conducted in March 2023:
|
CustomerID |
Age |
Income |
Satisfaction |
|
1001 |
34 |
65000 |
8 |
|
1002 |
45 |
82000 |
7 |
|
1003 |
29 |
54000 |
9 |
Use cases :
- Market research and surveys
- Benchmarking across business units or competitors
- Regression analysis to understand relationships between variables
Limitation : Cannot capture changes over time or dynamics.
Time Series Data
Time series data captures observations of a single entity (or aggregated entities) over multiple time periods.
Example : Monthly sales for a single store:
|
Month |
Sales |
|
2023-01 |
125000 |
|
2023-02 |
132000 |
|
2023-03 |
128000 |
Use cases :
- Forecasting (sales, demand, stock prices)
- Trend analysis
- Seasonality detection
- Anomaly detection
Limitation : Focuses on a single entity; cannot compare across entities simultaneously.
Panel Data (Longitudinal Data)
Panel data combines both dimensions: multiple entities observed over multiple time periods.
Example : Monthly sales for multiple stores:
|
StoreID |
Month |
Sales |
|
S01 |
2023-01 |
125000 |
|
S01 |
2023-02 |
132000 |
|
S02 |
2023-01 |
98000 |
|
S02 |
2023-02 |
103000 |
Use cases :
- Comparing trends across entities
- Controlling for entity-specific effects in analysis
- Understanding both cross-sectional and temporal variation
- Advanced econometric and statistical modeling
Advantage : Richest structure, enables the most sophisticated analyses.
Why This Matters for Analytics
The structure of your data determines:
- Which analytical methods are appropriate : Time series methods (ARIMA, exponential smoothing) require time series data. Panel data methods (fixed effects models) require panel structure.
- How to visualize data : Line charts for time series, bar charts for cross-sectional comparisons, heatmaps or small multiples for panel data.
- What questions you can answer : Cross-sectional data can't answer "how is this changing over time?" Time series data can't answer "how do different segments compare?"
Understanding your data structure is the first step in selecting the right analytical approach.
=== data types, wide, melt, …
3.3 Data Sources in Organizations
Modern organizations generate and collect data from a dizzying array of sources. Understanding these sources—their characteristics, strengths, and limitations—is essential for effective analytics.
3.3.1 Internal Systems: ERP, CRM, POS, Web Analytics, IoT
Most organizational data originates from internal operational systems. These systems are designed primarily to support business processes, not analytics, which creates both opportunities and challenges.
Enterprise Resource Planning (ERP) Systems
ERP systems integrate core business processes: finance, accounting, procurement, inventory, manufacturing, human resources.
Examples : SAP, Oracle ERP, Microsoft Dynamics, NetSuite
Data available :
- Financial transactions (general ledger, accounts payable/receivable)
- Procurement and supplier data
- Inventory levels and movements
- Production schedules and outputs
- Employee records and payroll
Analytics use cases :
- Financial performance analysis
- Supply chain optimization
- Cost analysis and profitability
- Workforce analytics
Challenges :
- Complex data models with many interconnected tables
- Data may be optimized for transaction processing, not analysis
- Requires domain expertise to interpret correctly
- Data extraction can be technically challenging
Customer Relationship Management (CRM) Systems
CRM systems manage customer interactions, sales processes, and marketing campaigns.
Examples : Salesforce, HubSpot, Microsoft Dynamics 365
Data available :
- Customer profiles and contact information
- Sales pipeline and opportunity data
- Customer service interactions and cases
- Marketing campaign responses
- Customer communication history
Analytics use cases :
- Sales forecasting and pipeline analysis
- Customer segmentation
- Campaign effectiveness measurement
- Customer lifetime value modeling
- Churn prediction
Challenges :
- Data quality depends on user discipline in data entry
- Incomplete or inconsistent records
- May not capture all customer touchpoints (e.g., offline interactions)
Point of Sale (POS) Systems
POS systems capture retail transactions at the moment of purchase.
Examples : Square, Shopify POS, NCR, Toast (restaurants)
Data available :
- Transaction-level sales data (products, quantities, prices, timestamps)
- Payment methods
- Store/location information
- Promotions and discounts applied
- (Sometimes) customer identification through loyalty programs
Analytics use cases :
- Sales trend analysis
- Product performance and assortment optimization
- Pricing analysis
- Store performance comparison
- Demand forecasting
Strengths :
- High-quality, granular transactional data
- Real-time or near-real-time availability
- Relatively clean and structured
Web Analytics Platforms
Web analytics systems track user behavior on websites and mobile apps.
Examples : Google Analytics, Adobe Analytics, Mixpanel, Amplitude
Data available :
- Page views, sessions, and user journeys
- Traffic sources (organic search, paid ads, social media, direct)
- Conversion events (purchases, sign-ups, downloads)
- User demographics and interests (where available)
- Device and browser information
Analytics use cases :
- Conversion funnel analysis
- A/B testing and experimentation
- Content performance evaluation
- Customer journey mapping
- Marketing attribution
Challenges :
- Privacy regulations limit data collection (cookie consent, tracking restrictions)
- Bots and spam can distort metrics
- Linking web behavior to known customers requires integration with other systems
- Sampling in high-traffic environments
Internet of Things (IoT) and Sensor Data
IoT devices and sensors generate continuous streams of data from physical assets and environments.
Examples :
- Manufacturing equipment sensors (temperature, pressure, vibration)
- Fleet management GPS and telematics
- Smart building systems (HVAC, lighting, occupancy)
- Wearable devices
- Retail foot traffic sensors
Data available :
- Real-time operational metrics
- Location and movement data
- Environmental conditions
- Equipment status and performance
Analytics use cases :
- Predictive maintenance
- Energy optimization
- Route optimization
- Space utilization
- Quality control
Challenges :
- Very high volume and velocity (streaming data)
- Requires specialized infrastructure for storage and processing
- Sensor accuracy and calibration issues
- Integration with other business data
Integration Challenges
Each internal system typically operates in isolation, with its own data model, identifiers, and update cycles. Effective analytics often requires integrating data across systems—for example:
- Linking CRM customer records to POS transactions to understand purchase behavior
- Combining ERP inventory data with web analytics to optimize stock levels based on online demand signals
- Integrating IoT sensor data with ERP maintenance records for predictive maintenance models
This integration is technically and organizationally challenging but essential for comprehensive analytics.
3.3.2 External and Open Data Sources
Organizations increasingly supplement internal data with external sources to enrich analysis, benchmark performance, and gain broader context.
Purchased Data
Many organizations buy data from specialized providers:
Examples :
- Market research data : Consumer surveys, brand tracking, market sizing (Nielsen, Gartner, Forrester)
- Credit and financial data : Credit scores, financial statements, risk ratings (Experian, Dun & Bradstreet, Bloomberg)
- Demographic and geographic data : Population statistics, income levels, geographic boundaries (Esri, Census data providers)
- Industry benchmarks : Performance metrics, salary surveys, best practices
Benefits :
- Access to data that would be expensive or impossible to collect internally
- Professional quality and standardization
- Broader market perspective
Challenges :
- Cost
- Licensing restrictions on use and sharing
- May not perfectly align with internal data definitions
- Quality and methodology may be opaque
Open and Public Data
Governments, international organizations, and research institutions publish vast amounts of data freely available for use.
Examples :
- Government statistical agencies : Economic indicators, employment data, trade statistics, census data (e.g., U.S. Census Bureau, Eurostat, World Bank)
- Regulatory filings : Company financial reports, patent databases, clinical trial registries
- Scientific and research data : Academic datasets, climate data, health statistics
- Open data portals : City and regional data on transportation, crime, infrastructure (e.g., data.gov, European Data Portal)
Benefits :
- Free or low-cost
- Often high quality and well-documented
- Enables benchmarking and contextual analysis
Challenges :
- May not be timely (published with delays)
- Aggregation levels may not match business needs
- Requires effort to find, understand, and integrate
Web Scraping and APIs
Organizations can collect data directly from websites and online platforms through web scraping or application programming interfaces (APIs).
Examples :
- Competitor pricing from e-commerce sites
- Social media sentiment and mentions
- Job postings and labor market trends
- News and media coverage
- Product reviews and ratings
Benefits :
- Access to real-time, granular data
- Can be tailored to specific needs
Challenges :
- Legal and ethical considerations (terms of service, copyright, privacy)
- Technical complexity and maintenance
- Data quality and consistency issues
- Rate limits and access restrictions
Third-Party Data Partnerships
Organizations sometimes establish data-sharing partnerships with complementary businesses.
Example :
- A retailer and a credit card company sharing aggregated transaction data
- Supply chain partners sharing inventory and demand data
- Industry consortia pooling data for benchmarking
Benefits :
- Access to unique, relevant data
- Mutual value creation
Challenges :
- Competitive sensitivity
- Privacy and confidentiality concerns
- Governance and legal agreements
- Technical integration
Key Considerations for External Data
When incorporating external data:
- Relevance : Does it address a specific business question or gap in internal data?
- Quality : Is it accurate, complete, and reliable?
- Timeliness : Is it updated frequently enough for your needs?
- Cost : Does the value justify the expense?
- Legal and ethical : Do you have the right to use it? Are there privacy or competitive concerns?
- Integration : Can it be linked to internal data effectively?
External data is most valuable when it complements internal data, providing context, benchmarks, or enrichment that internal data alone cannot provide.
3.4 Data Quality Dimensions
High-quality data is the foundation of trustworthy analytics. Poor data quality leads to incorrect insights, bad decisions, and erosion of trust in analytics. Yet data quality is often taken for granted until problems emerge.
Data quality is multidimensional. A dataset might be strong on some dimensions and weak on others. Understanding these dimensions helps diagnose problems and prioritize improvements.
3.4.1 Accuracy, Completeness, Consistency, Timeliness, Uniqueness
Accuracy
Accuracy refers to how well data reflects the true state of the real-world entities or events it represents.
Examples of accuracy problems :
- Customer address is outdated (customer moved)
- Product price is entered incorrectly
- Sensor reading is miscalibrated
- Survey respondent provides false information
Impact :
- Incorrect conclusions and predictions
- Operational errors (e.g., shipping to wrong address)
- Compliance violations
Detection methods :
- Validation against authoritative sources
- Cross-checking with other data
- Statistical outlier detection
- User feedback and complaints
Mitigation strategies :
- Input validation and constraints at data entry
- Regular data audits and verification
- Automated data quality checks
- Training for data entry personnel
Completeness
Completeness refers to the extent to which all required data is present.
Examples of completeness problems :
- Missing customer email addresses
- Incomplete transaction records (missing timestamps)
- Null values in critical fields
- Entire records missing due to system failures
Impact :
- Biased analysis (if missingness is not random)
- Inability to perform certain analyses
- Reduced statistical power
- Operational disruptions
Detection methods :
- Counting null or missing values
- Comparing record counts across systems
- Monitoring data pipeline completeness
Mitigation strategies :
- Mandatory fields in data entry forms
- Default values where appropriate
- Imputation techniques (with caution)
- Root cause analysis of why data is missing
Consistency
Consistency refers to whether data is uniform across systems, time periods, and representations.
Examples of consistency problems :
- Customer name spelled differently in CRM vs. ERP ("John Smith" vs. "J. Smith")
- Product categories defined differently across regions
- Date formats varying (MM/DD/YYYY vs. DD/MM/YYYY)
- Units of measurement inconsistent (kilograms vs. pounds)
Impact :
- Difficulty integrating data across sources
- Duplicate or conflicting records
- Incorrect aggregations and comparisons
- Confusion and mistrust
Detection methods :
- Cross-system data reconciliation
- Duplicate detection algorithms
- Schema comparison
- Data profiling tools
Mitigation strategies :
- Standardized data definitions and formats
- Master data management
- Reference data and lookup tables
- Data integration and transformation rules
Timeliness
Timeliness refers to whether data is available when needed and reflects the current state of affairs.
Examples of timeliness problems :
- Sales data updated only weekly, but decisions need daily information
- Customer profile not updated after address change
- Inventory data delayed by hours, causing stockouts or overstock
- Stale data used in real-time decision systems
Impact :
- Decisions based on outdated information
- Missed opportunities
- Operational inefficiencies
- Customer dissatisfaction
Detection methods :
- Monitoring data freshness (time since last update)
- Comparing timestamps across systems
- User complaints about outdated information
Mitigation strategies :
- Real-time or near-real-time data pipelines
- Automated data refresh schedules
- Clear SLAs for data availability
- Prioritizing timeliness for time-sensitive use cases
Uniqueness
Uniqueness (or lack of duplication) refers to whether each real-world entity is represented exactly once in the dataset.
Examples of uniqueness problems :
- Same customer appears multiple times with slight variations in name or contact info
- Duplicate transaction records due to system errors
- Multiple product records for the same item
Impact :
- Inflated counts and metrics
- Incorrect aggregations
- Confusion about which record is authoritative
- Wasted resources (e.g., sending multiple marketing emails to same person)
Detection methods :
- Duplicate detection algorithms (fuzzy matching)
- Unique identifier validation
- Record linkage techniques
Mitigation strategies :
- Unique identifiers (primary keys) enforced at data entry
- Deduplication processes in data pipelines
- Master data management
- Data stewardship and manual review for ambiguous cases
3.4.2 Detecting and Handling Data Quality Issues
Data quality problems are inevitable. The question is not whether they exist, but how to detect and address them systematically.
Detection Strategies
1. Data Profiling
Automated analysis of datasets to understand structure, content, and quality:
- Summary statistics (min, max, mean, distribution)
- Null value counts
- Unique value counts
- Pattern detection (e.g., email format, phone number format)
- Outlier identification
Tools : Python (pandas profiling), specialized data quality tools, database profiling features
2. Data Quality Rules and Checks
Explicit rules that data must satisfy:
- Range checks (age between 0 and 120)
- Format checks (email contains @)
- Referential integrity (every transaction references a valid customer)
- Business logic checks (order date before ship date)
These can be implemented as:
- Database constraints
- Validation logic in applications
- Automated tests in data pipelines
3. Cross-System Reconciliation
Comparing data across systems to identify discrepancies:
- Do customer counts match between CRM and billing system?
- Do sales totals in POS match financial system?
- Are inventory levels consistent across warehouse management and ERP?
4. Statistical Anomaly Detection
Using statistical methods to identify unusual patterns:
- Sudden spikes or drops in metrics
- Values far from historical norms
- Unexpected correlations or lack thereof
5. User Feedback
End users often discover data quality issues in the course of their work:
- Complaints about incorrect information
- Questions about unexpected results
- Reports that "don't look right"
Establishing channels for users to report issues is essential.
Handling Strategies
Once data quality issues are detected, several approaches can be taken:
1. Prevention at Source
The best approach is to prevent problems from entering the system:
- Input validation and constraints
- User training and clear data entry guidelines
- Automated data capture (reducing manual entry)
- Regular system maintenance and calibration
2. Correction
Fixing errors in the data:
- Manual correction by data stewards
- Automated correction based on rules (e.g., standardizing formats)
- Imputation of missing values using statistical methods
- Deduplication and record merging
Caution : Automated correction can introduce new errors. Document all changes and validate results.
3. Flagging and Documentation
When correction is not feasible or certain, flag problematic data:
- Quality indicators or confidence scores attached to records
- Documentation of known issues
- Warnings in reports and dashboards
This allows analysts to make informed decisions about whether and how to use the data.
4. Exclusion
In some cases, the best approach is to exclude low-quality data from analysis:
- Filter out records with critical missing values
- Exclude outliers that are clearly errors
- Limit analysis to high-quality data subsets
Caution : Exclusion can introduce bias if the excluded data is systematically different from included data.
5. Acceptance and Mitigation
Sometimes data quality issues cannot be fully resolved, and the best approach is to:
- Acknowledge limitations in analysis and reporting
- Use robust statistical methods less sensitive to data quality issues
- Triangulate findings using multiple data sources
- Communicate uncertainty clearly to stakeholders
Data Quality Metrics and Monitoring
Organizations serious about data quality establish ongoing monitoring:
- Data quality scorecards : Regular measurement of quality dimensions across key datasets
- Automated alerts : Notifications when quality metrics fall below thresholds
- Trend analysis : Tracking whether data quality is improving or degrading over time
- Root cause analysis : Investigating the sources of quality problems to address them systematically
The Cost-Benefit Balance
Perfect data quality is neither achievable nor necessary. The goal is "fit for purpose" quality—good enough to support the decisions and processes that depend on it.
Investments in data quality should be prioritized based on:
- Business impact : Which data quality issues cause the most harm?
- Frequency : How often do problems occur?
- Cost to fix : What is the effort required to improve quality?
- Feasibility : Can the root cause be addressed, or only symptoms?
High-impact, high-frequency, low-cost-to-fix issues should be prioritized. Low-impact issues may be accepted and documented rather than fixed.
3.5 Basics of Data Governance
Data governance is the framework of policies, processes, roles, and responsibilities that ensure data is managed as a strategic asset. Without governance, data quality degrades, security risks increase, compliance failures occur, and trust in data erodes.
Effective data governance balances control (ensuring data is managed properly) with enablement (making data accessible and useful).
3.5.1 Roles and Responsibilities (Data Owners, Stewards)
Clear accountability is the foundation of data governance. Key roles include:
Data Owners
Data owners are senior business leaders accountable for specific data domains (e.g., customer data, product data, financial data).
Responsibilities :
- Define business rules and quality standards for their data domain
- Approve access to sensitive data
- Resolve disputes about data definitions or usage
- Sponsor data quality and governance initiatives
- Ensure compliance with regulations
Example : The Chief Marketing Officer might be the data owner for customer data, accountable for how customer information is collected, used, and protected.
Data Stewards
Data stewards are individuals (often from business units) responsible for the day-to-day management and quality of specific datasets.
Responsibilities :
- Monitor data quality and address issues
- Document data definitions, lineage, and business rules
- Coordinate with IT on data-related projects
- Serve as subject matter experts for their data domain
- Enforce data governance policies
Example : A product manager might serve as data steward for the product catalog, ensuring product information is accurate, complete, and consistently defined.
Data Custodians
Data custodians (typically IT staff) are responsible for the technical management of data: storage, security, backup, and access control.
Responsibilities :
- Implement technical controls and security measures
- Manage databases and data infrastructure
- Execute data backup and recovery procedures
- Provide technical support for data access
Data Governance Council or Committee
Many organizations establish a cross-functional governance body to:
- Set enterprise-wide data policies and standards
- Prioritize data initiatives
- Resolve cross-domain issues
- Monitor governance effectiveness
Membership typically includes : Data owners, senior IT leaders, legal/compliance, analytics leaders, and business unit representatives.
Data Users
All employees who access and use data have responsibilities:
- Follow data governance policies
- Use data ethically and appropriately
- Report data quality issues
- Protect sensitive data
Why Roles Matter
Without clear roles, data governance becomes "everyone's responsibility and no one's responsibility." Ambiguity leads to:
- Data quality problems that no one fixes
- Security gaps
- Inconsistent definitions and practices
- Lack of accountability
Formalizing roles ensures someone is responsible for each aspect of data management.
3.5.2 Policies, Standards, and Data Catalogs
Data Policies
Data policies are high-level principles and rules governing data management. Common policies address:
Data Access and Security
- Who can access what data, under what conditions?
- How is sensitive data classified and protected?
- What authentication and authorization mechanisms are required?
Data Quality
- What quality standards must data meet?
- Who is responsible for ensuring quality?
- How are quality issues escalated and resolved?
Data Retention and Disposal
- How long is data retained?
- When and how is data archived or deleted?
- What legal or regulatory requirements apply?
Data Usage and Ethics
- What are acceptable uses of data?
- How is customer privacy protected?
- What restrictions apply to sharing data externally?
Data Sharing and Integration
- How is data shared across business units or with external partners?
- What approvals are required?
- What technical and legal safeguards apply?
Policies should be:
- Clear and concise : Avoid jargon; make them understandable to non-technical users
- Actionable : Provide specific guidance, not just principles
- Enforceable : Include consequences for violations
- Regularly reviewed : Update as business needs and regulations evolve
Data Standards
Standards provide technical specifications and conventions:
Naming Conventions
- How are tables, fields, and files named?
- Example: customer_id vs. CustomerID vs. cust_id
Data Formats
- Date formats (ISO 8601: YYYY-MM-DD)
- Currency representation
- Units of measurement
Data Definitions
- Standardized business glossary
- Example: What exactly is a "customer"? Does it include prospects? Former customers?
Reference Data
- Standard codes and classifications (country codes, product categories, status codes)
Metadata Standards
- What metadata must be captured for each dataset?
- How is lineage documented?
Standards reduce ambiguity, facilitate integration, and improve data quality.
Data Catalogs
A data catalog is a centralized inventory of an organization's data assets, providing:
Discovery
: Users can search for and find relevant datasets
Documentation
: Descriptions, definitions, and metadata for each dataset
Lineage
: Where data comes from, how it's transformed, and where it's used
Quality Indicators
: Data quality metrics and known issues
Access Information
: How to access the data and who to contact
Example catalog entry :
Dataset
: Customer Transactions
Description
: All purchase transactions from retail stores and e-commerce
Owner
: VP of Sales
Steward
: Sales Analytics Manager
Source Systems
: POS (stores), Shopify (online)
Update Frequency
: Daily at 2 AM
Key Fields
: transaction_id, customer_id, product_id, quantity, price, timestamp, channel
Quality Score
: 92/100
Known Issues
: ~2% of transactions missing customer_id (guest checkouts)
Access
: Request via IT Service Portal
Data catalogs are essential for:
- Reducing time spent searching for data
- Avoiding duplicate data collection efforts
- Understanding data context and limitations
- Promoting data reuse and collaboration
Modern data catalog tools (e.g., Alation, Collibra, Apache Atlas) provide automated discovery, AI-powered recommendations, and collaboration features.
3.5.3 Regulatory and Compliance Considerations (GDPR, etc.)
Data governance is not just good practice—it's often legally required. Organizations face a complex and evolving landscape of data regulations.
General Data Protection Regulation (GDPR)
GDPR, enacted by the European Union in 2018, is one of the most comprehensive data privacy regulations globally.
Key principles :
- Lawfulness, fairness, transparency : Data must be processed lawfully and transparently
- Purpose limitation : Data collected for specific purposes, not used for unrelated purposes
- Data minimization : Collect only what is necessary
- Accuracy : Keep data accurate and up to date
- Storage limitation : Retain data only as long as necessary
- Integrity and confidentiality : Protect data with appropriate security
Key rights for individuals :
- Right to access their data
- Right to correction
- Right to erasure ("right to be forgotten")
- Right to data portability
- Right to object to processing
Implications for analytics :
- Consent management for data collection
- Anonymization or pseudonymization of personal data
- Data retention policies and automated deletion
- Impact assessments for high-risk processing
- Ability to respond to data subject requests
Penalties : Up to €20 million or 4% of global annual revenue, whichever is higher
California Consumer Privacy Act (CCPA) and Similar Laws
CCPA and similar U.S. state laws (Virginia, Colorado, etc.) provide privacy rights similar to GDPR:
- Right to know what data is collected
- Right to deletion
- Right to opt out of sale of personal information
- Non-discrimination for exercising rights
Industry-Specific Regulations
Healthcare (HIPAA in U.S.)
- Strict controls on protected health information (PHI)
- Requirements for data security, access controls, and breach notification
Financial Services (SOX, PCI-DSS, etc.)
- Sarbanes-Oxley (SOX): Financial data accuracy and internal controls
- PCI-DSS: Credit card data security standards
- Anti-money laundering (AML) and know-your-customer (KYC) data requirements
Other Regulations
- Children's Online Privacy Protection Act (COPPA): Data from children under 13
- Sector-specific rules in telecommunications, energy, transportation, etc.
Compliance Implications for Data Governance
Regulations drive governance requirements:
- Data inventory : Know what data you have, where it is, and how it's used
- Classification : Identify sensitive, personal, or regulated data
- Access controls : Restrict access based on need and role
- Audit trails : Log who accessed what data, when, and why
- Data subject rights : Processes to respond to access, correction, and deletion requests
- Breach response : Procedures to detect, report, and remediate data breaches
- Vendor management : Ensure third parties handling data comply with regulations
- Documentation : Maintain records of data processing activities, consent, and compliance measures
Balancing Compliance and Analytics
Regulations can create tension with analytics objectives:
- Privacy rules may limit data collection or use
- Anonymization may reduce analytical value
- Deletion requirements may conflict with historical analysis needs
- Consent requirements may reduce data availability
Strategies to balance compliance and analytics:
- Privacy by design : Build privacy considerations into analytics from the start
- Anonymization and aggregation : Use techniques that protect privacy while enabling analysis
- Purpose-specific consent : Obtain consent for analytics uses where required
- Data minimization : Collect and retain only what is truly needed
- Transparency : Clearly communicate how data is used in analytics
Organizations that treat compliance as a constraint to work around risk penalties and reputational damage. Those that embrace privacy and responsible data use as core values build trust and sustainable competitive advantage.
3.6 Metadata and Data Lineage for Trustworthy Analytics
Metadata—"data about data"—and data lineage—the history and flow of data—are essential for trustworthy, reproducible analytics. Without them, analysts waste time rediscovering context, make errors due to misunderstanding data, and cannot trace problems back to their source.
What Is Metadata?
Metadata describes the characteristics, context, and structure of data. It answers questions like:
- What does this field mean?
- Where did this data come from?
- When was it last updated?
- Who is responsible for it?
- What format is it in?
- What quality issues are known?
Types of Metadata
Technical Metadata
- Data types (integer, string, date, etc.)
- Field lengths and constraints
- Database schemas and table structures
- File formats and encoding
- Storage locations
Business Metadata
- Business definitions and glossary terms
- Data ownership and stewardship
- Business rules and calculations
- Relationships to business processes
- Usage guidelines and restrictions
Operational Metadata
- Data refresh schedules and frequencies
- Last update timestamps
- Data quality metrics
- Access logs and usage statistics
- System performance metrics
Why Metadata Matters
For Analysts :
- Understand what data means and how to use it correctly
- Discover relevant datasets
- Assess data quality and limitations
- Avoid misinterpretation
For Data Engineers :
- Design and maintain data pipelines
- Troubleshoot data issues
- Optimize performance
- Ensure consistency across systems
For Governance :
- Enforce policies and standards
- Track compliance
- Manage access and security
- Respond to audits and data subject requests
What Is Data Lineage?
Data lineage traces the flow of data from its origin through transformations to its final use. It answers:
- Where did this data come from originally?
- What transformations were applied?
- What systems and processes touched it?
- Where is it used downstream?
- Who is impacted if this data changes?
Example of Data Lineage :
Source: POS System (raw sales transactions)
↓
ETL Process: Nightly batch job
- Filters out test transactions
- Joins with product master data
- Aggregates to daily store-product level
↓
Data Warehouse: sales_daily table
↓
BI Dashboard: Store Performance Dashboard (used by regional managers)
↓
ML Model: Demand Forecasting Model (used for inventory planning)
If a data quality issue is discovered in the demand forecast, lineage allows you to trace back through the warehouse, ETL process, and ultimately to the POS system to identify the root cause.
Benefits of Data Lineage
Impact Analysis
- If a source system changes, what downstream reports and models are affected?
- If a field definition changes, who needs to be notified?
Root Cause Analysis
- When a metric looks wrong, trace back to find where the problem originated
Compliance and Auditability
- Demonstrate how personal data is processed (required by GDPR and similar regulations)
- Provide audit trails for financial and regulatory reporting
Data Quality Management
- Understand where quality issues are introduced
- Prioritize improvements based on downstream impact
Reproducibility
- Recreate analyses and understand how results were produced
- Validate and verify analytical findings
Implementing Metadata and Lineage Management
Manual Documentation
- Data dictionaries and glossaries
- Process documentation
- README files and code comments
Pros
: Simple, flexible
Cons
: Labor-intensive, quickly becomes outdated, not scalable
Automated Metadata Capture
- Data profiling tools that automatically extract technical metadata
- ETL tools that capture lineage as pipelines are built
- Query log analysis to understand data usage
Pros
: Scalable, always current
Cons
: Requires tooling investment, may miss business context
Data Catalog Platforms
- Centralized platforms that combine automated discovery with manual curation
- Collaborative features for business users to add context
- Lineage visualization and impact analysis
Pros
: Comprehensive, user-friendly, supports governance
Cons
: Cost, implementation effort, requires organizational adoption
Best Practices
-
Capture metadata at the source
: Build metadata capture into data creation and transformation processes, not as an afterthought
-
Standardize metadata
: Use consistent schemas and vocabularies across the organization
-
Make metadata accessible
: Ensure analysts and business users can easily find and understand metadata
-
Keep metadata current
: Automate updates where possible; establish processes for manual updates
-
Link technical and business metadata
: Connect technical field names to business terms and definitions
-
Visualize lineage
: Graphical representations are much more useful than text descriptions
-
Integrate with workflows
: Embed metadata and lineage into analytics tools, not separate systems
Metadata and Lineage as Enablers of Trust
Trustworthy analytics requires transparency. Stakeholders need to understand:
- What data was used
- Where it came from
- How it was processed
- What assumptions were made
- What limitations exist
Comprehensive metadata and lineage provide this transparency. They transform analytics from a "black box" into a transparent, auditable process. This builds confidence in insights and enables informed decision-making.
Organizations that invest in metadata and lineage management find that:
- Analysts spend less time searching for and understanding data
- Data quality improves because issues are identified and traced faster
- Compliance and audit processes are streamlined
- Trust in analytics increases across the organization
- Analytics becomes more scalable and sustainable
3.7 Using Large Language Models to Accelerate Data and Business Understanding
One of the most time-consuming challenges for business analysts is developing deep understanding of unfamiliar business domains and complex datasets. Traditionally, this required extensive reading of documentation, interviews with subject matter experts, and trial-and-error exploration of data. Large Language Models (LLMs) have emerged as powerful tools to accelerate this learning process.
LLMs can serve as interactive knowledge assistants, helping analysts:
- Understand business terminology and concepts
- Generate hypotheses about data relationships
- Interpret data patterns in business context
- Identify potential data quality issues
- Suggest relevant analytical approaches
However, effective use of LLMs requires a structured, iterative approach. Simply asking a single broad question rarely produces useful results. Instead, analysts should engage in conversational exploration —a series of progressively refined prompts that build understanding incrementally.
The Iterative Prompting Framework
Effective use of LLMs for business and data understanding typically follows this pattern:
1. Context Setting → 2. Broad Exploration → 3. Focused Investigation → 4. Validation and Refinement → 5. Application
Let's explore this framework through practical examples.
Example 1: Understanding a New Business Domain
Imagine you're a business analyst who has just joined a pharmaceutical company's analytics team. You've been asked to analyze clinical trial data, but you have limited healthcare industry knowledge.
Phase 1: Context Setting
Initial Prompt:
I'm a business analyst working with clinical trial data for a pharmaceutical
company. I have a strong background in analytics but limited knowledge of the
pharmaceutical industry. Can you explain the key stages of a clinical trial
and what data is typically collected at each stage?
LLM Response Summary: The LLM explains the four phases of clinical trials (Phase I-IV), typical duration, participant numbers, and objectives of each phase. It describes common data types: safety data, efficacy data, adverse events, patient demographics, etc.
Phase 2: Broad Exploration
Follow-up Prompt:
Thank you. I'm specifically working with Phase III trial data. What are the
most important metrics and KPIs that pharmaceutical companies track during
Phase III trials? What would be considered success or failure indicators?
LLM Response Summary: The LLM describes primary and secondary endpoints, statistical significance requirements, safety profiles, dropout rates, and regulatory considerations.
Phase 3: Focused Investigation
Follow-up Prompt:
I have a dataset with the following fields: patient_id, treatment_group,
baseline_score, week_4_score, week_8_score, week_12_score, adverse_events,
dropout_flag, dropout_reason.
What analytical questions should I be asking with this data? What potential
data quality issues should I look for?
LLM Response Summary: The LLM suggests:
- Comparing treatment vs. control group outcomes
- Analyzing dropout patterns and reasons
- Checking for missing data patterns (are dropouts related to adverse events?)
- Looking for baseline imbalances between groups
- Examining adverse event frequencies and severity
Phase 4: Validation and Refinement
Follow-up Prompt:
I noticed that 15% of patients have missing week_12_scores, and most of these
are in the treatment group. The dropout_flag shows "True" for only 8% of
patients. What might explain this discrepancy? What are the implications for
my analysis?
LLM Response Summary: The LLM explains potential reasons (data collection issues, patients still in trial, administrative censoring) and discusses the critical importance of understanding missingness mechanisms in clinical trials. It warns about potential bias if missing data is related to treatment effects.
Phase 5: Application
Follow-up Prompt:
Based on this discussion, help me draft a list of questions I should ask the
clinical trial manager before proceeding with my analysis. Prioritize the
questions by importance.
LLM Response Summary: The LLM provides a prioritized list of clarifying questions about data collection protocols, missing data mechanisms, adverse event definitions, and analysis expectations.
Example 2: Understanding Complex Data Relationships
You're analyzing e-commerce data and encounter multiple related tables with unclear relationships.
Phase 1: Context Setting
Initial Prompt:
I'm working with an e-commerce database that has the following tables:
- customers (customer_id, signup_date, country, segment)
- orders (order_id, customer_id, order_date, total_amount, status)
- order_items (order_item_id, order_id, product_id, quantity, price)
- products (product_id, product_name, category, supplier_id)
- returns (return_id, order_item_id, return_date, reason, refund_amount)
I need to understand how these tables relate to each other and what business
questions they can answer. Can you explain the relationships and suggest a
logical way to think about this data structure?
LLM Response Summary: The LLM explains the entity-relationship structure: customers place orders, orders contain order_items, order_items reference products, and order_items can have returns. It describes this as a typical transactional e-commerce schema.
Phase 2: Broad Exploration
Follow-up Prompt:
What are the most common business questions that would require joining these
tables? Give me 5 examples with increasing complexity.
LLM Response Summary: The LLM provides examples:
- Total revenue by customer (customers + orders)
- Most popular products (order_items + products)
- Return rate by product category (returns + order_items + products)
- Customer lifetime value by segment (customers + orders + order_items - returns)
- Supplier performance analysis (products + order_items + returns)
Phase 3: Focused Investigation
Follow-up Prompt:
I want to calculate customer lifetime value (CLV) accurately. Walk me through
the logic step-by-step. What fields do I need from each table? What
calculations are required? What potential pitfalls should I watch for?
LLM Response Summary: The LLM provides detailed calculation logic:
- Sum all order_items.price × quantity for each customer
- Subtract refund_amount from returns
- Consider order status (exclude cancelled orders)
- Watch for: partial returns, cancelled orders, currency consistency, date ranges
Phase 4: Validation and Refinement
Follow-up Prompt:
I calculated CLV and found that 5% of customers have negative CLV values.
What could cause this? Is this a data quality issue or a legitimate business
scenario?
LLM Response Summary: The LLM explains possible causes:
- Legitimate: customers who returned more than they kept (especially with free shipping)
- Data issues: returns linked to wrong customers, duplicate return records, incorrect refund amounts
- Business logic: promotional credits, loyalty rewards not captured in the data
It suggests validation queries to investigate each possibility.
Phase 5: Application
Follow-up Prompt:
Create a data quality checklist I should work through before finalizing my
CLV analysis. Include specific SQL-like logic I should check.
LLM Response Summary: The LLM provides a detailed checklist with validation queries for referential integrity, duplicate detection, null value patterns, and business logic validation.
Example 3: Interpreting Unexpected Data Patterns
You discover an anomaly in your data and need help understanding potential causes.
Phase 1: Context Setting
Initial Prompt:
I'm analyzing monthly sales data for a retail chain. I noticed that Store #47
shows a sudden 300% increase in sales in March 2024 compared to February 2024,
while all other stores show normal seasonal patterns (5-10% increase). The
store's sales return to normal levels in April 2024.
What are the possible explanations for this pattern? Help me think through
both data quality issues and legitimate business scenarios.
LLM Response Summary: The LLM provides two categories of explanations:
Data Quality Issues:
- Duplicate transactions recorded
- Transactions from another store misattributed
- Data entry error (extra zero in amounts)
- System glitch during data migration
Legitimate Business Scenarios:
- Special promotion or event
- Bulk purchase by corporate client
- Store reopening after renovation
- Seasonal inventory clearance
- Local event driving traffic
Phase 2: Broad Exploration
Follow-up Prompt:
How can I use the data itself to distinguish between these possibilities?
What patterns should I look for in the transaction-level data?
LLM Response Summary: The LLM suggests diagnostic analyses:
- Check transaction count vs. average transaction value
- Look at product mix (is it normal or unusual?)
- Examine customer IDs (new customers or existing?)
- Check timestamps (concentrated in time or spread throughout month?)
- Compare payment methods
- Look for duplicate transaction IDs
Phase 3: Focused Investigation
Follow-up Prompt:
I checked and found:
- Transaction count increased by 50% (not 300%)
- Average transaction value increased by 150%
- 80% of the high-value transactions occurred on March 15-17
- Most high-value transactions were for electronics (normally 20% of sales,
but 70% in March)
- Customer IDs appear normal (mix of existing and new)
What does this pattern suggest?
LLM Response Summary: The LLM analyzes the pattern and suggests this looks like a legitimate business event—likely a promotional sale focused on electronics during a specific weekend. The pattern is consistent with a planned marketing campaign rather than a data quality issue.
Phase 4: Validation and Refinement
Follow-up Prompt:
How should I verify this hypothesis? What additional data sources or
stakeholders should I consult?
LLM Response Summary: The LLM recommends:
- Check marketing calendar for promotions
- Review store manager reports for March
- Look for similar patterns in previous years (annual sale?)
- Check if other stores had similar electronics promotions
- Verify with finance that revenue was actually received
- Look at return rates in April (high returns might indicate data issues)
Phase 5: Application
Follow-up Prompt:
Assuming this was a legitimate promotion, how should I handle this data point
in my sales forecasting model? Should I include it, exclude it, or adjust it?
LLM Response Summary: The LLM discusses options:
- If promotion is recurring: include it and add a promotional indicator variable
- If one-time event: consider excluding or creating a separate forecast for promotional periods
- Alternative: use robust forecasting methods less sensitive to outliers
- Document the decision and its rationale
Best Practices for Using LLMs in Data and Business Understanding
1. Start Broad, Then Narrow Begin with general context-setting questions, then progressively focus on specific issues. Avoid jumping directly to narrow technical questions without establishing context.
2. Provide Concrete Examples Instead of asking "How do I analyze customer data?", provide actual field names, sample values, and specific patterns you're observing. The more concrete your prompt, the more useful the response.
3. Iterate Based on Responses Treat the interaction as a conversation. Use the LLM's response to formulate better follow-up questions. Each exchange should build on previous ones.
4. Request Structured Outputs Ask for checklists, step-by-step procedures, or prioritized lists. Structured outputs are easier to act on than narrative explanations.
5. Challenge and Validate Don't accept LLM responses uncritically. Ask follow-up questions like:
- "What assumptions are you making?"
- "What are the limitations of this approach?"
- "What could go wrong?"
- "How would I validate this?"
6. Combine LLM Insights with Domain Expertise LLMs provide general knowledge and reasoning, but they don't know your specific business context. Always validate LLM suggestions with subject matter experts and actual data exploration.
7. Document Your Learning As you work through iterative prompts, document key insights and decisions. This creates a knowledge base for future reference and helps onboard other team members.
Prompt Templates for Common Scenarios
Understanding Business Terminology
I'm working on [PROJECT/DOMAIN] and encountered the term [TERM].
In this context, what does it mean? How is it typically measured or
calculated? What are common misconceptions about this term?
Interpreting Data Structures
I have a dataset with these fields: [LIST FIELDS WITH DATA TYPES].
What business process or entity does this likely represent? What are
the key relationships I should understand? What analyses would be most
relevant?
Diagnosing Data Quality Issues
I'm seeing [SPECIFIC PATTERN] in my data. This seems unusual because
[CONTEXT]. What are possible explanations? How can I investigate further?
What validation checks should I perform?
Generating Analytical Hypotheses
I'm analyzing [BUSINESS PROBLEM] with data on [DATA DESCRIPTION].
What are 5-7 hypotheses I should test? For each hypothesis, what would
I expect to see in the data if it's true?
Bridging Technical and Business Language
I found that [TECHNICAL FINDING]. Help me translate this into business
language for [AUDIENCE]. What are the business implications? What actions
might this suggest?
Limitations and Cautions
While LLMs are powerful tools for accelerating understanding, they have important limitations:
1. No Access to Your Specific Data LLMs can't see your actual data (unless you explicitly share samples, which raises privacy concerns). They provide general guidance, not data-specific insights.
2. Potential for Hallucination LLMs sometimes generate plausible-sounding but incorrect information. Always verify critical facts, especially industry-specific regulations, technical specifications, or statistical methods.
3. Lack of Current Information LLMs have knowledge cutoff dates and may not reflect recent industry changes, new regulations, or emerging best practices.
4. Generic Advice LLM responses are based on general patterns in training data. They may miss nuances specific to your organization, industry, or use case.
5. Privacy and Security Risks Be cautious about sharing sensitive business information, proprietary data, or personally identifiable information in prompts. Use anonymized examples when possible.
6. Over-Reliance Risk LLMs should augment, not replace, critical thinking and domain expertise. Use them as a starting point for investigation, not as the final authority.
Integrating LLMs into Your Analytics Workflow
Phase 1: Initial Learning (Project Start)
- Use LLMs to quickly understand unfamiliar business domains
- Generate initial hypotheses and analytical approaches
- Create checklists and frameworks for data exploration
Phase 2: Data Exploration
- Interpret unexpected patterns or anomalies
- Generate ideas for feature engineering
- Understand potential data quality issues
Phase 3: Analysis
- Validate analytical approaches
- Troubleshoot technical issues
- Generate alternative methods to consider
Phase 4: Communication
- Translate technical findings into business language
- Generate visualization ideas
- Draft executive summaries (with heavy editing)
Phase 5: Documentation
- Create data dictionaries and documentation
- Document analytical decisions and rationale
- Generate training materials for stakeholders
Practical Exercise: Guided LLM Exploration
To practice using LLMs effectively, try this exercise:
Scenario : You've been given a dataset with these fields:
- account_id, transaction_date, transaction_type, amount, balance_before, balance_after, merchant_category, location, device_type, risk_score
Task : Use an LLM to understand this dataset through iterative prompting:
- First prompt : Ask the LLM what type of business/domain this data likely represents
- Second prompt : Based on the response, ask what the most important analytical questions would be
- Third prompt : Ask about potential data quality issues to check for
- Fourth prompt : Present a hypothetical anomaly and ask for diagnostic approaches
- Fifth prompt : Ask how to communicate findings to a non-technical executive
Document your prompts and key insights from each response. Reflect on:
- Which prompts were most effective?
- What follow-up questions led to the most useful insights?
- Where did you need to validate or challenge the LLM's responses?
- How would you improve your prompting strategy?
Key Takeaway
Large Language Models are powerful accelerators for business and data understanding, but they are tools, not oracles. The most effective analysts use LLMs as interactive thinking partners—asking good questions, iterating based on responses, validating suggestions, and combining LLM insights with domain expertise and actual data exploration. Mastering this iterative, conversational approach to LLM use is becoming an essential skill for modern business analysts.
Exercises
Exercise 3.1: Data Type Classification
Classify each of the following data examples into the appropriate categories:
a)
Structure
: Structured, Semi-Structured, or Unstructured
b)
Functional Type
: Transactional, Master, or Reference (if applicable)
c)
Temporal Structure
: Cross-Sectional, Time Series, or Panel (if applicable)
- A CSV file containing daily stock prices for 500 companies over 5 years
- A collection of customer service call recordings (audio files)
- A database table listing all employees with their ID, name, department, and hire date
- A JSON file from a social media API containing user posts, likes, and comments
- A table of ISO country codes with country names and regions
- A log file from a web server showing each page request with timestamp, IP address, and URL
- A PDF annual report from a competitor
- A survey dataset with responses from 1,000 customers collected in March 2024
- An Excel file tracking monthly sales by product category for each store over 3 years
- A database table recording every credit card transaction with card number, merchant, amount, and timestamp
Exercise 3.2: Data Quality Assessment
You are provided with a sample customer dataset (see table below). Evaluate the data quality along the five dimensions discussed in Section 3.4.1. For each dimension, identify specific issues and rate the quality as High, Medium, or Low. Provide recommendations for improvement.
|
CustomerID |
Name |
|
Phone |
SignupDate |
Country |
LastPurchase |
TotalSpent |
|
1001 |
Jane Smith |
jane@email.com |
555-0101 |
2023-01-15 |
USA |
2024-02-10 |
1250.00 |
|
1002 |
Carlos Garcia |
carlos@email |
555-0102 |
2023-02-20 |
Spain |
2024-01-05 |
890.50 |
|
1003 |
Jane Smith |
jsmith@email.com |
555-0101 |
2023-01-15 |
USA |
2024-02-10 |
1250.00 |
|
1004 |
Li Wei |
|
555-0104 |
2023-03-10 |
China |
|
0.00 |
|
1005 |
Maria Santos |
maria@email.com |
555-0105 |
15/04/2023 |
Brazil |
2024-03-01 |
2100.75 |
|
1006 |
John Doe |
john@email.com |
555-0106 |
2023-05-01 |
USA |
2024-02-28 |
-50.00 |
|
1007 |
Ahmed Hassan |
ahmed@email.com |
555-0107 |
2023-06-15 |
Egypt |
2024-03-15 |
450.00 |
|
1008 |
Emma Wilson |
emma@email.com |
555-0108 |
2023-07-20 |
UK |
2022-12-01 |
3200.00 |
Prepare a brief report (1-2 pages) covering:
- Accuracy issues and recommendations
- Completeness issues and recommendations
- Consistency issues and recommendations
- Timeliness issues and recommendations (assume today is 2024-03-20)
- Uniqueness issues and recommendations
- Overall quality rating and priority actions
Exercise 3.3: Data Governance Charter
You are part of a newly formed analytics team at a mid-sized retail company. The company has recognized the need for better data governance and has asked your team to draft a simple data governance charter.
Create a 2-3 page document that includes:
-
Purpose and Scope
: What is the goal of data governance in your organization? What data domains are covered?
-
Roles and Responsibilities
: Define at least four key roles (e.g., Data Owner, Data Steward, Data Governance Council, Data Users) and their responsibilities.
-
Key Policies
: Outline 3-5 high-level data policies (e.g., data quality standards, data access and security, data retention).
-
Data Standards
: Specify at least 3 data standards (e.g., naming conventions, date formats, customer definition).
-
Governance Processes
: Describe 2-3 key processes (e.g., how data quality issues are reported and resolved, how new data sources are onboarded, how access requests are approved).
-
Success Metrics
: How will you measure whether data governance is effective?
Be specific and practical. Tailor your charter to a retail context (you can make reasonable assumptions about the company's size, systems, and challenges).
Exercise 3.4: Data Quality Risk Analysis (Case Study)
Scenario :
MediSupply Inc. is a medical device distributor that sells products to hospitals and clinics. The company uses several systems:
- An ERP system for inventory, orders, and financials
- A CRM system for customer relationships and sales pipeline
- A separate legacy system for regulatory compliance documentation
- Spreadsheets maintained by individual sales reps for territory planning
The company wants to build a demand forecasting model to optimize inventory levels. The analytics team has identified the following data quality issues:
-
Product codes are inconsistent
across systems. The same product might be "PROD-12345" in ERP, "P12345" in CRM, and "12345-A" in the legacy system.
-
Customer information is duplicated
. Large hospital systems have multiple entries in the CRM (one per facility), but the ERP treats them as a single customer. Sales reps' spreadsheets use yet another customer identification scheme.
-
Order dates are sometimes missing or incorrect
in the ERP. When orders are entered manually, dates are occasionally left blank or set to default values.
-
Inventory data is updated only once per day
(overnight batch), but orders can be placed throughout the day, leading to occasional overselling.
-
Historical data before 2021 is incomplete
due to a system migration that didn't fully transfer old records.
-
Product categorization has changed twice
in the past three years, making trend analysis difficult.
Your Task :
Prepare a risk analysis and mitigation plan:
a) Risk Assessment : For each data quality issue, assess:
- Which quality dimension(s) are affected (accuracy, completeness, consistency, timeliness, uniqueness)
- Potential impact on the demand forecasting model (High/Medium/Low)
- Likelihood of causing significant problems (High/Medium/Low)
b) Prioritization : Rank the issues from highest to lowest priority based on impact and likelihood.
c) Mitigation Strategies : For the top 3 priority issues, propose:
- Short-term workarounds (what can be done immediately to reduce risk)
- Long-term solutions (what systemic changes would address the root cause)
- Estimated effort and resources required
d) Communication : Draft a brief executive summary (1 paragraph) explaining the data quality risks and your recommended approach to the VP of Operations.
Exercise 3.5: Metadata and Lineage Documentation
Choose a simple analytical workflow you're familiar with (or use the example below). Document the metadata and lineage for this workflow.
Example Workflow :
- Extract daily sales transactions from a POS system
- Clean the data (remove test transactions, handle missing values)
- Join with product master data to add product categories
- Aggregate to daily sales by category
- Load into a data warehouse table
- Create a dashboard showing sales trends by category
- Use the aggregated data as input to a sales forecasting model
Your Task :
Create documentation that includes:
a) Data Lineage Diagram : Create a visual representation (you can hand-draw and scan, or use a tool like PowerPoint, draw.io, or Lucidchart) showing:
- Source systems
- Transformation steps
- Intermediate datasets
- Final outputs
- Arrows showing data flow
b) Metadata Table : For each dataset in the lineage (at least 3), document:
- Dataset name
- Description
- Key fields (name, type, description)
- Source
- Update frequency
- Data owner/steward
- Known quality issues
c) Transformation Documentation : For at least 2 transformation steps, document:
- What transformation is performed
- Business logic/rules applied
- Why this transformation is necessary
- Potential impact on data quality or interpretation
d) Impact Analysis : If the product master data source were to change its category definitions, what downstream impacts would occur? List all affected components and stakeholders.